Monday, May 18, 2026
Acceptance Rate Is a Vanity Metric. Here's What to Measure Instead
Every AI coding tool ships with a dashboard, and every one of those dashboards leads with the same number: acceptance rate. The percentage of suggestions your engineers accepted. It's prominent, it trends upward, and it tells you almost nothing.
An engineer can accept a suggestion, rewrite half of it, and ship it. Accepted. Another can accept boilerplate all day while avoiding the tool for anything that matters. High acceptance rate. A third can reject ten suggestions on the way to one that saves her an afternoon. Low acceptance rate, high value. The metric can't distinguish between these engineers, which means it can't tell you anything you can act on.
Vendor dashboards measure what's convenient for the vendor to measure. If you want to know whether AI is actually working for your team, you need to instrument three layers yourself.
Layer one: workflow integration
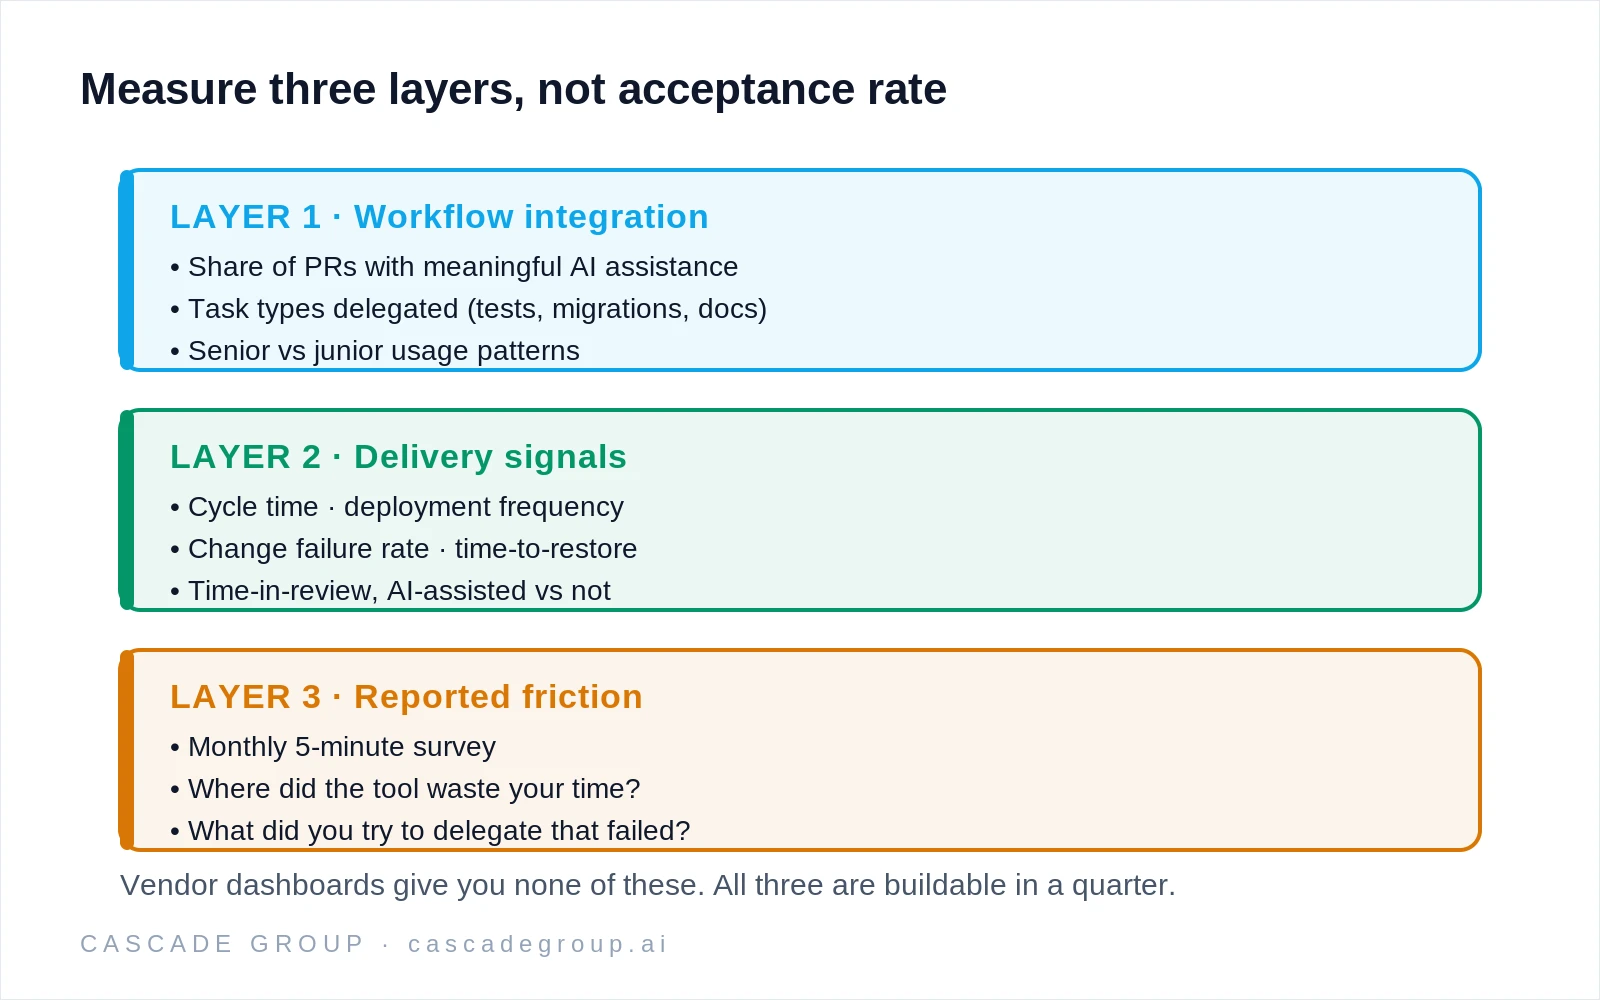
The question isn't "are engineers using the tool?" It's "which workflows have actually changed?" Concretely: what share of pull requests involved AI assistance in a meaningful way — generation, refactoring, test writing — versus autocomplete garnish? Which task types are engineers delegating (tests, migrations, documentation), and which are they still doing entirely by hand? How does usage differ between your senior and junior engineers?
That last one is more diagnostic than most leaders expect. When seniors use AI heavily and juniors don't, you usually have a trust and skills gap. When it's the reverse, you may have a quality problem incubating — juniors accepting output they can't yet evaluate.
Layer two: delivery signals
This is where DORA metrics earn their keep. Cycle time, deployment frequency, change failure rate, and time-to-restore are the closest things we have to ground truth about whether faster code generation is becoming faster delivery. Watch review time especially. In many organizations, AI-assisted PRs sit in review longer than human-written ones — reviewers trust them less and the PRs are often bigger. If your generation speed doubled and your review queue also doubled, your net gain may be close to zero, and your dashboard will never tell you.
The point isn't that AI should improve every DORA metric immediately. It's that these metrics catch the failure mode acceptance rates hide: individual productivity going up while system throughput stays flat.
Layer three: reported friction
Numbers tell you what's happening; they rarely tell you why. A short, recurring survey — five minutes, monthly — closes the loop. Where did the tool waste your time this month? What did you try to delegate that failed? What are you still doing manually that you suspect the tool could handle?
The pattern in the answers is the roadmap. If a third of your team says the tool falls apart on your legacy service, that's a context and configuration problem you can fix. If juniors report they don't know when to trust output, that's an enablement problem. Neither shows up in any dashboard.
Start smaller than you think
You don't need a measurement platform to start. A baseline of your DORA metrics, a way to tag AI-assisted PRs, and a monthly friction survey will put you ahead of most engineering organizations I talk to. The goal isn't precision — it's being able to answer "is this working?" with something better than a vendor's chart.
Getting that measurement loop stood up is the core of our adoption reporting engagement, and the thinking behind it is laid out in the Adoption Model if you want to build it yourself.